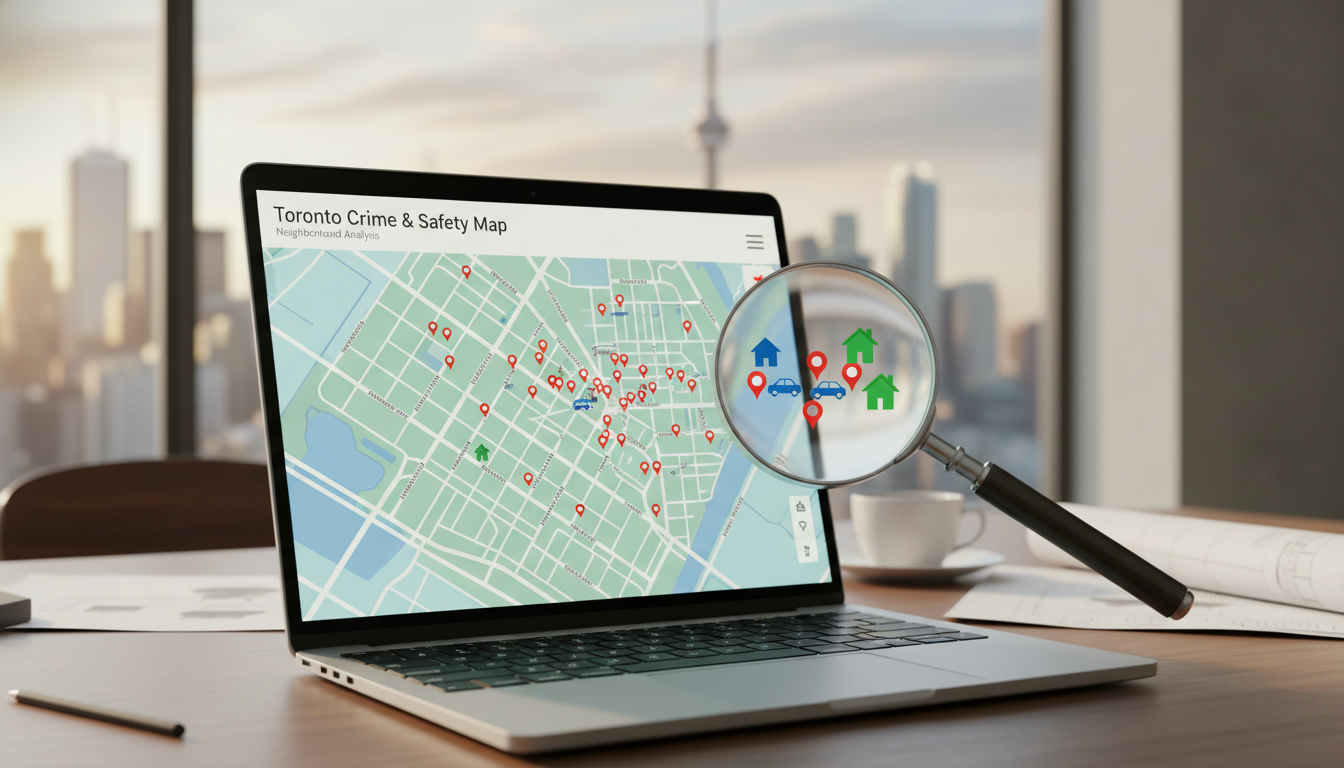
How do I research local crime statistics?
Want to know if a neighborhood is safe? Read this before you move.
Quick answer
Research local crime statistics by using official police data and government open-data portals, checking crime maps, normalizing numbers per capita, comparing multi-year trends, and verifying with local sources. That’s the practical path to confident decisions about neighborhood safety.
The step-by-step plan (do this now)
- Start with official police data: Search your city or regional police service website for crime maps and downloadable crime reports (example: Toronto Police Service Crime Maps). These are primary sources for neighborhood crime rates.
- Use government sources: Check Statistics Canada or your country’s public safety portal for crime rates, victimization surveys, and long-term trends.
- Pull a crime map: Tools like CrimeReports, SpotCrime, or your municipal open data portal show incidents by location and date. Use filters for the last 12 months and for the specific crime types that matter to you.
- Normalize the numbers: Convert raw incident counts to rates per 1,000 people. A neighborhood with 50 incidents but 20,000 residents is different from one with 10 incidents and 500 residents.
- Check trends, not one-off spikes: Compare 3–5 years of data. Look for rising trends in the crimes you care about (violent crime, break-ins, auto theft).
- Verify boundaries: Neighborhood borders in crime tools differ. Cross-check with municipal maps so you’re measuring the right area.
- Talk to local sources: Community associations, school staff, and local realtors have on-the-ground knowledge about safety and recent changes.
- Visit at different times: Walk the area during daytime and after dark. Observe lighting, foot traffic, and security measures.
- Cross-check with other sources: News reports, neighbourhood social media groups, and municipal open data add context.

How to interpret the data
- Focus on rates per capita and trend direction.
- Separate violent crime from property crime; they affect buyers differently.
- Look for clustering. A few hotspots near transit or commercial strips may not reflect the whole neighborhood.
- Beware of underreporting. Some crimes are less likely to be reported; community surveys help here.
Examples and trusted sources
- Canada: Statistics Canada (statcan.gc.ca), Toronto Police Service Crime Maps (torontopolice.on.ca), municipal open data portals.
- Tools: CrimeMaps, SpotCrime, NeighborhoodScout (U.S.), local police open-data APIs.
Final call-to-action
If you’re buying, renting, or selling, you need a local expert who reads crime data and translates it into real decisions. Tony Sousa combines real estate experience with neighborhood analysis. Email tony@sousasells.ca, call 416-477-2620, or visit https://www.sousasells.ca for a custom crime-data review of your target area. No spin. Just facts you can act on.
Need a street-level report for a specific address? Ask now and get a clear, data-backed safety summary before you sign anything.


