How do I evaluate local traffic patterns before buying?
Want to buy a home? Here’s how to expose hidden traffic problems before you sign.
Why traffic beats curb appeal in long-term value
Traffic shapes daily life. It affects commute time, resale, noise, safety, and livability. Ignore it and you buy headaches. Evaluate traffic like an investor: with data, a checklist, and a repeatable process.
Fast, actionable plan to evaluate local traffic patterns
1) Pull the numbers first
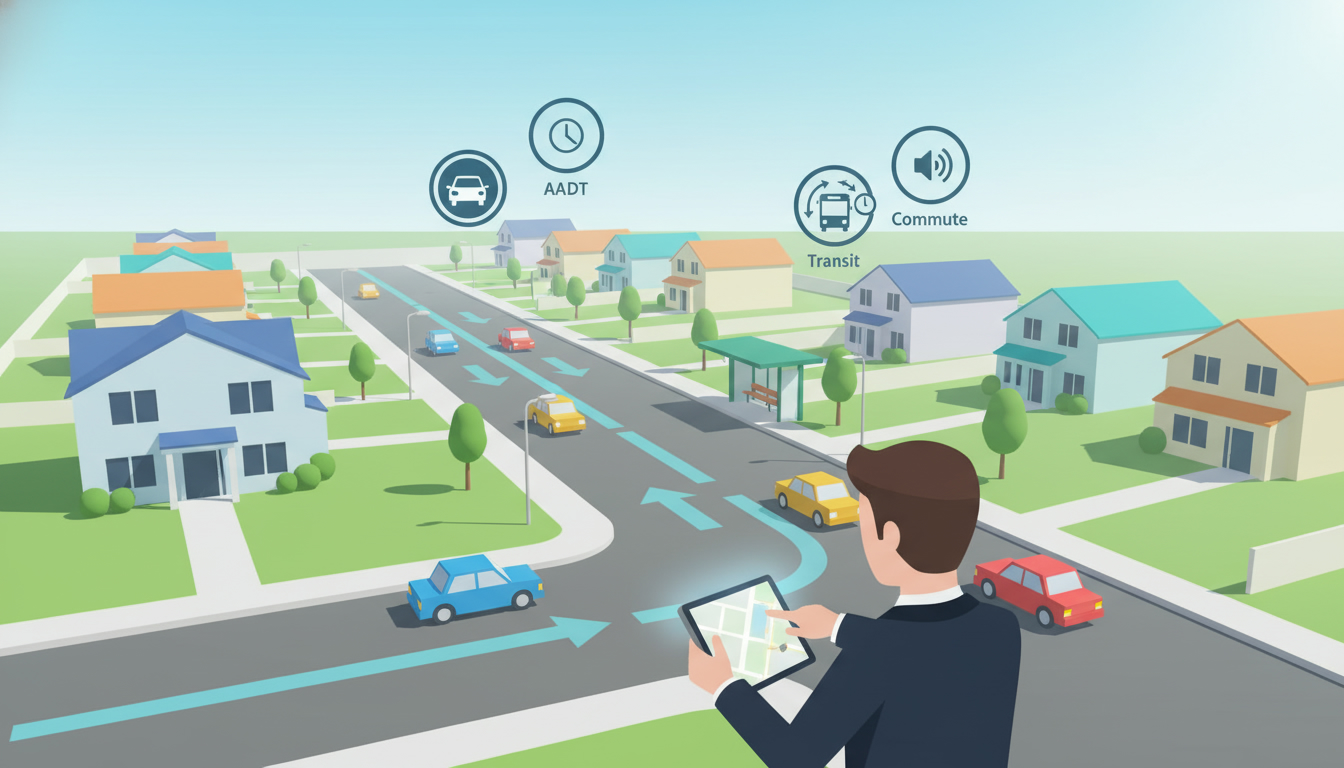
- Get AADT (Average Annual Daily Traffic) from the city or state DOT. Rule of thumb: >15,000 vehicles/day = major arterial; 5,000–15,000 = moderate; <5,000 = quiet neighborhood. High AADT means noise and reduced resale appeal for single-family homes.
- Check crash data: local police, CrashMap, or state crash reports. Look for frequent accidents at the property’s nearest intersections.
2) Test commute times like a buyer and a worker
- Use Google Maps/Waze ‘Depart at’ for multiple days and times (weekday AM/PM, Saturday). Record best, average, worst times. If variance >30% you face unpredictable commutes.
- Drive the route yourself at those times. Apps lie to feelings; your car and stopwatch don’t.
3) Observe patterns on-site
- Visit at morning rush, evening rush, and midday. Watch for heavy trucks, school drop-offs, and delivery vehicles.
- Note noise levels (subjective if no meter). If you can’t hold a normal conversation from the front yard during peak, that’s a red flag.
4) Check transit and walkability
- Count minutes to nearest rapid transit, bus stop, or commuter rail. Good score: <10 minutes to reliable transit.
- Look at sidewalks, crosswalks, bike lanes, and pedestrian signals. Missing infrastructure decreases safety and future demand.
5) Research planned projects
- Check city planning, zoning changes, and permit applications. New commercial developments and road widenings change traffic patterns and property values—often for bad.
6) Talk to neighbors and pros
- Ask residents about hidden rushes (school/plant shifts) and seasonal spikes.
- Ask your realtor for local traffic studies or professional traffic engineer summaries.

Quick scoring system (0–10)
- Traffic Volume (AADT): 0–3 pts
- Peak Delay Variance: 0–2 pts
- Noise/Heavy Vehicles: 0–2 pts
- Transit/Walkability: 0–2 pts
- Future Risk (developments): 0–1 pt
Score 8–10: solid. 5–7: acceptable with caveats. <5: rethink or demand price reduction.
Tools and sources to use now
- Google Maps, Waze, INRIX/TomTom reports, local DOT, city planning website, CrashMap, Street View, site visits at multiple times.
If you want a simple, repeatable traffic evaluation for any listing, I’ve built one that pulls data, scores it, and gives a one-page recommendation you can use to negotiate or walk away.
Tony Sousa is a local market expert who uses this system daily to protect buyers from costly traffic surprises. Reach out for a traffic-checked showing: tony@sousasells.ca | 416-477-2620 | https://www.sousasells.ca


