How do I find safe neighborhoods in Ontario?
“Want a genuinely safe neighborhood in Ontario? Here’s the quick, no-fluff plan to find one fast.”
Why safety matters — and what to measure
Safety is measurable. Stop guessing and start checking the right indicators: crime trends (not single incidents), Crime Severity Index (Statistics Canada), police call volumes, school safety, lighting, and local community engagement. Combine hard data with boots-on-the-ground insight and you’ll find neighborhoods that keep families and investments safe.
A 7-step system to find safe neighborhoods in Ontario (follow this)
- Check official crime data first
- Use Statistics Canada (Crime Severity Index) and municipal police open-data/crime maps (Toronto Police Service, OPP, local municipal portals). Look for stable low CSI and falling trend over 3–5 years.
- Compare similar-sized areas
- Don’t compare a small rural hamlet to a big city neighbourhood. Compare apples to apples: same population size, similar housing mix.
- Look at incident types, not just counts
- Focus on violent crime, break-and-enters, and repeat calls for service. Property crime spikes can be seasonal; violent and repeat patterns are core risk signals.
- Review community resources and amenities
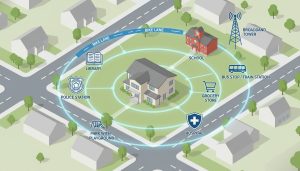
- Active community centres, well-maintained parks, local libraries, and youth programs lower crime long-term. Presence of neighbourhood watch or community patrols is a plus.
- Check walkability and lighting
- Well-lit streets, sidewalks, and visible foot traffic reduce opportunistic crime. Walk the area at evening rush hour to check lighting and activity.
- Scan social proof and local sentiment
- Read local Facebook groups, Nextdoor threads, and municipal council minutes. Residents will flag recurring issues faster than datasets show.
- Use a local expert for context
- Data needs interpretation. A local realtor or community expert connects patterns to causes (e.g., new transit, redevelopment, or policing changes) and shows immediate alternatives.

Key data sources to use now
- Statistics Canada — Crime Severity Index and neighbourhood profiles
- Municipal police open data and crime maps (Toronto Police, OPP, regional police)
- City open data portals — calls for service, 311 reports, property code complaints
- School safety reports and local school ratings
- Real estate trends — turnover, rental rates, and time-on-market
Quick tips that separate pros from amateurs
- Use 3–5 year trends, not one-year blips.
- Prioritize violent and repeat incidents over one-off property crimes.
- Cross-check data with in-person visits and community forums.
- Watch for infrastructure investments (new transit, schools) — they can improve safety fast.
Final step — get a neighbourhood safety brief
If you want a tailored safety assessment for any Ontario neighbourhood, get a concise report that combines crime stats, trend analysis, local amenities, and on-the-ground observations. I prepare these for buyers every week.
Contact Tony Sousa for a fast, data-backed neighbourhood safety briefing: tony@sousasells.ca | 416-477-2620 | https://www.sousasells.ca
Make the decision with facts, not fear. Follow the 7-step system and you’ll pick a neighbourhood that protects your life and your investment.

