How do supply and demand affect prices in my
neighborhood?
Can a few buyers change your neighbourhood prices overnight? Here’s the blunt truth.
Quick answer
Supply and demand set the price. When homes for sale are scarce and buyer interest is high, prices rise. When listings flood the market and buyers slow down, prices fall. That’s basic economics — and it plays out every day in local streets, condo towers, and family neighbourhoods.
How it works — plain and direct
- Supply = how many homes are for sale now.
- Demand = how many qualified buyers want those homes now.
- Price moves when one side changes faster than the other.
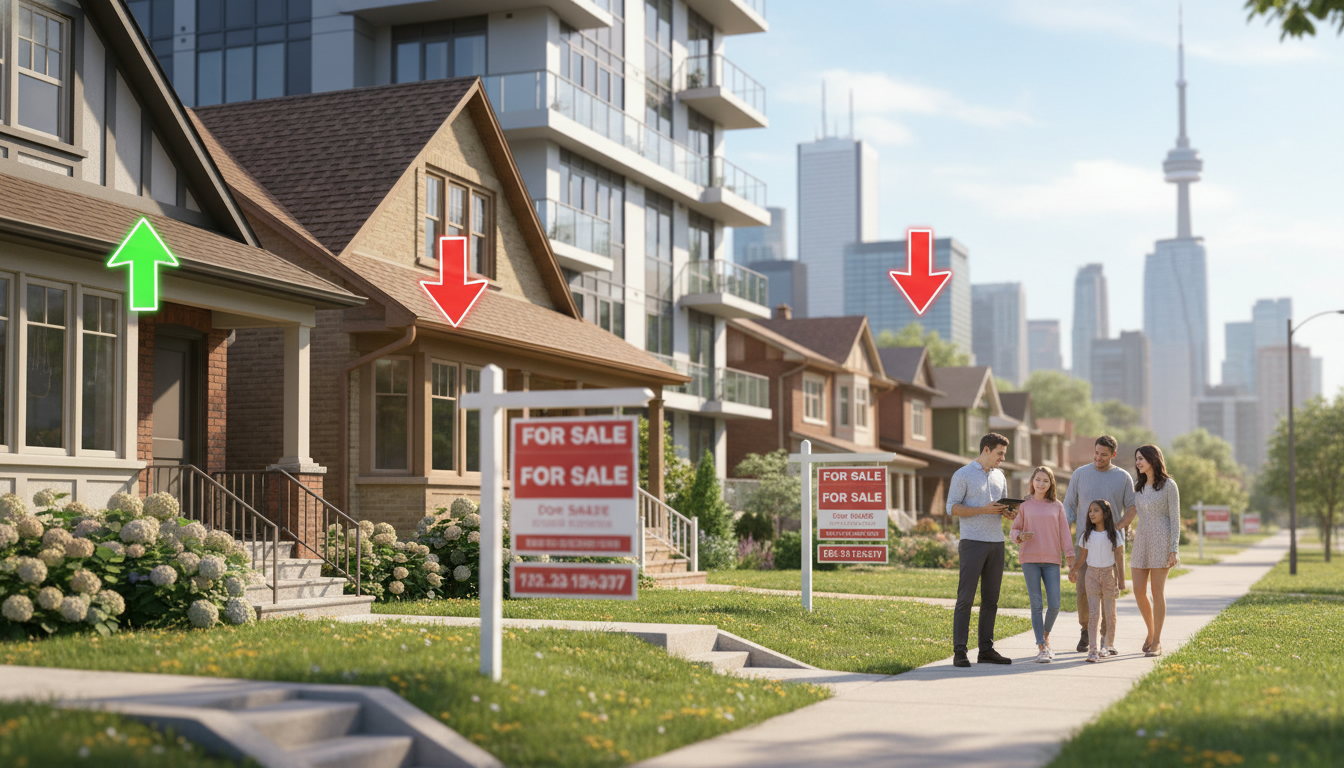
Example: If your neighbourhood has 10 active listings and 50 buyers ready to buy, buyers must compete. Competition drives offers above list price. If there are 50 listings and 10 buyers, sellers compete, and prices drop.
Three local signals to watch
- Days on Market (DOM): Fewer days = rising demand or low supply. If DOM drops from 30 to 7 days, expect upward pressure on prices.
- Inventory (Months of Supply): <3 months = sellers’ market; 3–6 months = balanced; >6 months = buyers’ market.
- Price-to-list ratio: If homes sell at 102% of list, buyers are paying premium. Below 98% means sellers are cutting prices.

Real-world moves that change supply or demand
- New condo towers release a wave of supply. More listings = price pressure.
- A major employer or transit line arrives. New demand pushes prices up.
- Mortgage rate changes. Rates rise → fewer buyers qualify → demand falls.
- Local zoning changes that allow infill housing increase supply over time.
How to use this as a homeowner or buyer
- Homeowners: Track local inventory and DOM. If supply tightens, consider listing sooner to capture higher prices.
- Buyers: Watch months of supply and price trends. In tight markets, have financing ready and set a firm max.
- Investors: Look for persistent low supply and rising rent — that’s where price appreciation follows.
Local insight from a market expert
Local markets move differently than national headlines. A city can show flat growth while specific neighbourhoods surge. That’s where local data matters: street-level listings, recent sale prices, and who’s buying (families, investors, downsizers).
If you want a direct, numbers-based read on your block — current inventory, comparable sales, and a 30-day price forecast — get the local market report.
Contact Tony Sousa for a clear neighbourhood market scan: tony@sousasells.ca | 416-477-2620 | https://www.sousasells.ca
Want the 30-day price forecast for your street? Ask for a free market snapshot and a practical action plan.


